Another Reason Your Mileage May Vary (for the Worse): Ethanol

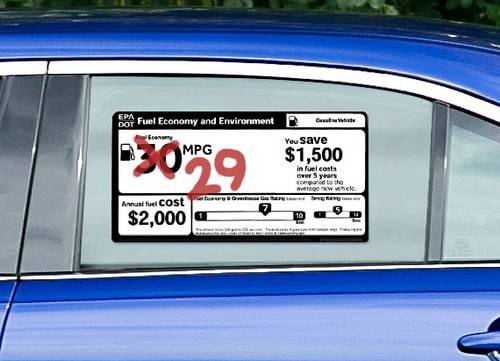
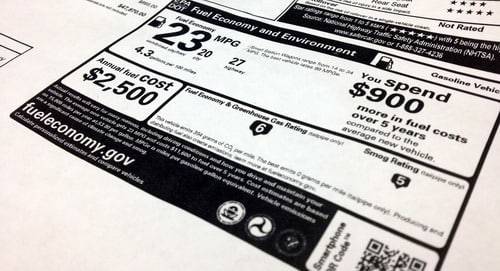
“Actual results will vary for many reasons,” says the fine print below the EPA gas mileage on any new car’s Monroney sticker. The sticker then lists a few of them: driving conditions, driving style, vehicle maintenance.
There’s one more: ethanol.
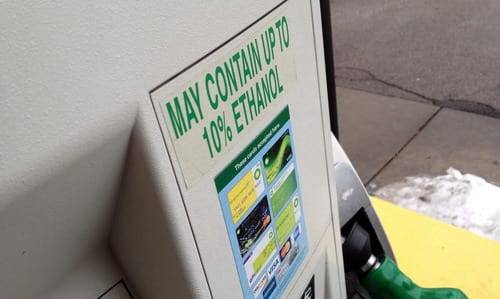
These days more than 95 percent of gas sold is E10, said AAA spokesman Michael Green. E10 is 10 percent ethanol and came into use after amendments in 1990 to the Clean Air Act, according to the Department of Energy. All cars are certified to run the stuff; in fact, it’s difficult to find ethanol-free, pure gas anymore.
Yet the more efficient ethanol-free blend is what the EPA uses to produce gas mileage figures posted on that new-car sticker.
And there’s the problem. Ethanol’s lower energy density leads to worse gas mileage, which is why using E85 (E85 is 85 percent ethanol) in cars with a fuel system that accommodate it is usually a bad idea. The math carries to E10, which has up to 10 percent ethanol. A gallon of E10 has 96.7 percent of the energy in one gallon of gasoline, according to the DOE’s Alternative Fuels Data Center.
That means E10 gas fractionally lowers real-world gas mileage. How much? Try about 3 percent compared to non-ethanol gas, said Toyota Senior Energy Researcher Mike McCarthy and Ford powertrain spokesman Paul Seredynski. AAA’s Green and the EPA both pegged the E10 loss between 3 and 4 percent. That means a car that sports a 30 mpg EPA combined figure is already hampered from achieving that miles-per-gallon number. The starting line is really 29 mpg.
Too Much Variation?
Why doesn’t the agency account for this? The EPA tackles the issue on its website.
“Changing [testing regulations] would be somewhat problematic,” the agency said. “While it is common for gasoline pumps to allow for up to 10 percent ethanol, the actual amount of ethanol blended into the gasoline varies greatly, and fuel blending requirements vary by state. Changing the test methods would also make it difficult to compare vehicles tested with ethanol blends with those tested with straight gasoline. So, without a national standard for blended regular gasoline and a federal mandate to change the test fuel used, the EPA will not change the test fuel.”
The explanation has merit. The only requirement for E10 is that it carries a maximum 10 percent ethanol, after all. And E10, while widespread, isn’t everywhere. Toyota’s McCarthy said exceptions include states such as Alaska and rural markets where ethanol distribution is difficult, as well as stations that pump ethanol-free fuel for marine engines. As recently as 2011, the Energy Information Administration reported ethanol levels in areas like the Rocky Mountains are below 8 percent.
But the case is thin today. Ethanol is on the rise. Total ethanol supply stood at 9.65 percent of all U.S. gasoline consumption in 2012, according to EIA; that’s up from 8 percent in 2010 and just 4.8 percent in 2007.
And just about all of that is E10. EIA argues that higher-ethanol gasoline like E85 and the still-debated E15 (15 percent ethanol) could throw off the ratio, but those volumes are scant. In a Nov. 29 proposal to reduce ethanol in gasoline due to limited supply, the EPA projected that ethanol-free gasoline (E0) and E15 “would be essentially zero” in 2014, and E85 would account for just 0.8 to 2.3 percent of all ethanol production.
That means, in all likelihood, E10 pumps average somewhere between 9 and 10 percent ethanol. Given that the fuel cannot be more than 10 percent ethanol, variations must be slight.
We reached out to multiple EPA sources to discuss the matter, but we have yet to obtain an interview.
29 mpg vs. 30 mpg
The E10 mileage penalty, meanwhile, adds up to about 1 mpg in a given car that’s EPA rated at 30 mpg combined city/highway. The penalty is slight, but every bit adds up — especially as EPA ratings have come under fire this year, and perhaps deservedly so. In August 2013, Ford reduced EPA mileage for the C-Max Hybrid to 43 mpg from 47 mpg. The automaker’s original EPA rating used the agency’s now-controversial “general label” rule. One day later, the EPA said it would revamp its rating system and hire more employees to audit mileage figures certified by automakers.
The EPA needs to adjust for E10 because it faces a credibility crisis if it doesn’t. Drivers are fed up with bad mileage: In J.D. Power and Associates’ 2013 Automotive Performance, Execution and Layout study, fuel economy ranked at the bottom of customer satisfaction.
“From a consumer’s perspective, when they see 35 miles per gallon city … that’s what they expect,” said Mike VanNieuwkuyk, J.D. Power’s executive director of global automotive. “They look at it as a mandate of what they should experience.”
Still a Comparison Tool?
That illustrates another issue. EPA mileage numbers have undergone myriad revisions to more closely reflect real-world driving, but stakeholders insist that they remain, at heart, a comparison tool.
“Because EPA protocols provide consistent test results, they allow customers to make uniform comparisons between different vehicle makes and models,” Toyota’s McCarthy said.
At they do a decent job of it. Take the owner-observed mileage satisfaction in J.D. Power’s APEAL study. Surveyed owners are, in theory, a more randomized group than drivers who report their mileage to the EPA. But APEAL’s ratings don’t show mileage. Rather, they depict a mileage satisfaction score that reflects everything from observed mileage to premium-fuel requirements and driving range.
Cars.com analyzed APEAL satisfaction scores for several popular vehicle classes and compared EPA ratings for mainstream versions of those cars. In most cases, the results suggest EPA numbers serve as a proper comparison. The agency rates the 2013 Honda Odyssey, for example, at 21 to 22 mpg (combined city/highway) depending on transmission. Driver-reported satisfaction from APEAL placed the Odyssey in the top tier of owner-reported fuel economy for minivans. By comparison, the EPA rates the 2013 Chrysler Town & Country at 20 mpg combined. In APEAL’s owner-reported fuel mileage satisfaction, the minivan placed two tiers down from the Odyssey.
Whether owners actually averaged 20 mpg in the Town & Country, however, is anybody’s guess.
“The EPA sticker was never designed to tell you what [fuel economy] you can expect to get from your car,” Ford’s Seredynski said. “It is a test designed to be very strictly followed by all automakers so that you can compare two cars you are literally window shopping. Only recently has the notion of the test changed in the minds of U.S. buyers.”
And, inevitably, they’re unhappy about it.
“We often hear consumers saying, ‘Well, when I bought the vehicle I thought the sticker said ‘X,’ and I’m not getting that,’ ” J.D. Power’s VanNieuwkuyk said. “They don’t necessarily understand all of the nuances as to what established that original rating.”
Voluntary Adjustments
To head off consumer frustrations, automakers could voluntarily rate cars lower than their EPA numbers for E10 or any other internally determined factors. But McCarthy said it would make little sense.
“It’s theoretically possible for manufacturers to elect to rate their vehicles lower than EPA numbers,” he said. But “any kind of arbitrary reduction would undercut the one of the primary purposes of the EPA metrics: to provide car buyers with standardized data to use when comparing vehicles on the market.”
Seredynski said adjusting figures for real-world driving “would be awesome,” but it’s easier said than done.
“How much should they be adjusted down?” he said. “To what style or manner of driving would be considered some sort of the mean? You? Me? An aunt? Great questions, and I’ve no idea. But the idea that the labels should reflect what the average Joe actually gets while driving is a relatively new concept, for the U.S., which is pretty fascinating.”
Automakers use those mileage ratings to market their cars, especially today, and it’s often a figure that’s easier for car shoppers to wrap their head around than horsepower or torque. After all, drivers see mileage returns at the pump, on a trip computer or even on smartphone apps.
Now there’s one more reason why those figures may never add up to what they saw on the sticker.
Related
EPA to Update Procedures to Keep Up With Industry
Loopholes and Fuzzy Math: The Tangled Science of MPG Ratings
More Industry News

Former Assistant Managing Editor-News Kelsey Mays likes quality, reliability, safety and practicality. But he also likes a fair price.
Featured stories
