DUI Fatalities Continue Decades-Long Slide


In 2013, 10,076 people died in drunken-driving crashes, roughly one every 52 minutes, according to the National Highway Traffic Safety Administration. Despite the nearly 424,000 fatal crashes involving a drunken driver that occurred between 1984 and 2013, the number of drunken-driving fatalities is on the decline.
Related: Could New Tech Make Drunken Driving a Thing of the Past?
Mothers Against Drunk Driving reports that since the organization’s foundation in 1980, drunken-driving deaths have been cut in half. According to NHTSA’s Fatality Analysis Reporting System, the total number of fatal accidents attributable to a motorist with a blood alcohol content of 0.08 or greater went from 19,329 in 1984 to 10,663 in 2013, a 45 percent drop. Meanwhile, states’ BAC limits became stricter.
Until about 15 years ago, the national standard for drunken driving was a BAC limit of 0.10. In 1998, President Bill Clinton proposed a 0.08 limit and signed legislation providing a half-billion dollars in incentive grants over six years to states that enacted and enforced it, according to NHTSA. By the year’s end, 16 states and the District of Columbia already had adopted the new standard, while dozens more introduced legislation to do so. In summer 2005, Minnesota became the last state to enact the 0.08 BAC limit — after which the number of fatal crashes in the U.S. involving a drunken driver steadily declined 22 percent from 13,685 that year to 10,663 eight years later.
Contributing to the Decline
In addition to the benefits of lowering the BAC, a host of other factors have contributed to the decline of fatal drunken-driving crashes. According to the Insurance Institute for Highway Safety, advancements between 1985 and 2012 in vehicles — such as structural design, technology, safety features, sophisticated crash-testing techniques and an evolving mix of vehicle types — had a major impact.
“There were 7,700 fewer driver deaths in 2012 alone than there would have been had vehicles remained the same since 1985,” IIHS said in a report earlier this year.
Five-Star States
For the past five years, MADD has been rating states according to their efforts to curb drunken driving. The five-star rating system is intended to encourage the adoption of MADD-endorsed countermeasures, including ignition interlocks for all convicted drunken-driving offenders; sobriety checkpoints; administrative license revocation, in which the officer confiscates the offender’s driver’s license immediately during the arrest; escalated child-endangerment penalties for drunken-driving convictions involving a child passenger; and “no-refusal events,” allowing investigating officers to quickly and easily obtain warrants to test suspects who refuse to submit to blood or breath tests.
One star is awarded to a state for each of the five measures it employs, for a total of five. Only five states earned a perfect five stars from MADD in 2011 — Arizona, Illinois, Kansas, Nebraska and Utah — but by 2014 that number increased to 10 and then to 13 as of this year. The other nine five-star states are Alabama, Colorado, Delaware, Maine, Mississippi, Missouri, West Virginia and Virginia.
Signs of Progress
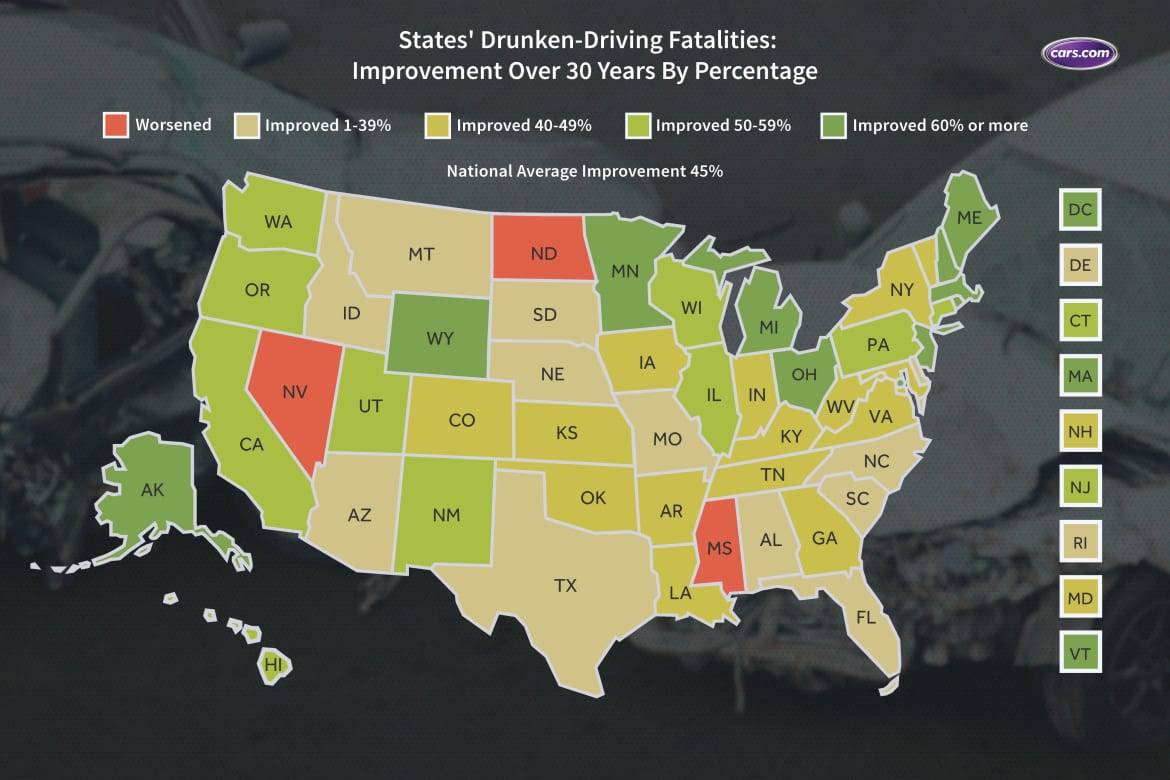
To illustrate how all of these and other measures have contributed to the decline in drunken-driving fatalities, we compared each state’s number of fatality crashes involving a driver with a BAC of at least 0.08 from 1984 and 2013, calculating the percentage improvement. Compared with the nation’s 45 percent overall improvement in those 30 years, 29 states and the District of Columbia landed at or above the U.S. average, while 18 states made gains below the national average. Only three states — Mississippi, Nevada and North Dakota — had more alcohol-related fatality crashes in 2013 than 30 years ago.

“During this time frame, the legislatures in these states [Mississippi, Nevada and North Dakota] did little to pass laws to deal with drunk driving,” J.T. Griffin, MADD chief government affairs officer, told Cars.com. “Just last year Mississippi took a huge step forward in addressing DUI by passing an all-offender ignition interlock law, which is MADD’s highest priority. We urge Nevada and North Dakota to do the same.”
While there has been plenty of ebb and flow in both the nation’s and the states’ progress over the years, the general trend is decidedly downward. As long as public awareness and action, automotive improvements and legislation continue to reduce drunken-driving deaths, we as a society will continue getting closer to the only acceptable number of drunken-driving deaths: zero.
“One day, drunk driving will be a thing of the past,” Griffin said.
Below is our list of all 50 states and the District of Columbia, their respective 2013 fatality-crash totals involving motorists with a BAC of at least 0.08, and their percentage improvement compared with 1984 in reducing drunken-driving fatalities:
- Alabama, 257 fatality crashes; 35%
- Alaska, 15; 78%
- Arizona, 263; 30%
- Arkansas, 135; 43%
- California, 991; 56%
- Colorado, 147; 47%
- Connecticut, 112; 55%
- Delaware, 43; 9%
- District of Columbia, 8; 72%
- Florida, 819; 33%
- Georgia, 319; 46%
- Hawaii, 35; 53%
- Idaho, 62; 30%
- Illinois, 328; 53%
- Indiana, 198; 47%
- Iowa, 94; 49%
- Kansas, 106; 45%
- Kentucky, 176; 40%
- Louisiana, 264; 41%
- Maine, 42; 62%
- Maryland, 154; 42%
- Massachusetts, 124; 63%
- Michigan, 276; 61%
- Minnesota, 101; 60%
- Mississippi, 210; (-6%)
- Missouri, 240; 34%
- Montana, 83; 20%
- Nebraska, 61; 35%
- Nevada, 100; (-1%)
- New Hampshire, 45; 46%
- New Jersey, 168; 53%
- New Mexico, 109; 56%
- New York, 406; 49%
- North Carolina, 393; 34%
- North Dakota, 55; (-38%)
- Ohio, 271; 64%
- Oklahoma, 174; 41%
- Oregon, 117; 54%
- Pennsylvania, 380; 50%
- Rhode Island, 26; 35%
- South Carolina, 350; 14%
- South Dakota, 40; 39%
- Tennessee, 268; 47%
- Texas, 1,345; 31%
- Utah, 46; 58%
- Vermont, 18; 63%
- Virginia, 247; 45%
- Washington, 154; 53%
- West Virginia, 91; 49%
- Wisconsin, 179; 52%
- Wyoming, 21; 70%
- U.S., 10,663; 45 percent

Former Assistant Managing Editor-News Matt Schmitz is a veteran Chicago journalist indulging his curiosity for all things auto while helping to inform car shoppers.
Featured stories


