Report: Vehicle Thefts Down 58 Percent Since 1991


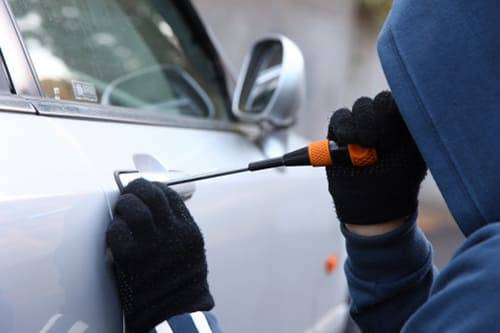
It’s the sort of threat most people don’t think about until it actually happens: stolen cars. But car theft is on a steep decline, according to new report from the National Insurance Crime Bureau. Citing recent data from the Federal Bureau of Investigation, the NICB says 699,594 cars were stolen in 2013. That’s down 58 percent from 1991, when vehicle theft hit a record 1,661,738.
Related: Heat Map Shows Auto-Theft Hot Spots
More impressively, the decline occurred while registered vehicles and the general population rose. In 1991, thieves purloined 659 cars for every 100,000 Americans. In 2013, the rate fell to just 221.3 cars per 100,000 people.
In historical terms, today’s rate isn’t the lowest. NICB notes that in 1960, thieves made off with just 182 cars for every 100,000 people. But a lot of that stems from lower ownership rates. Back then, every 10 Americans accounted for just 4.1 registered vehicles. By 2012, that density ballooned to 8.1 registered vehicles for every 10 Americans. The federal data referenced by NICB includes buses, motorcycles and heavy-duty trucks — all classified as motor vehicles by the Federal Highway Administration — but if you look at auto thefts as a percentage of all registered vehicles, not people, recent years present the lowest overall rate.
Why the decrease? The NICB points to better factory anti-theft systems, including smarter keys that thwart the age-old “hot-wiring” technique, more aftermarket anti-theft add-ons and more agencies responsible for investigating auto thefts, including 14 statewide auto-theft prevention authorities.
Still, where you live can make a big difference in the risk. Cars.com compared NICB’s state-by-state tally against motor vehicle registrations by state, with 2012 figures for both sets. (The FHA has not yet published 2013 figures, a spokesman told us.) The District of Columbia soared above all other states, with 11.36 cars stolen per every 1,000 vehicles registered — way above second-place California (6.09 thefts per every 1,000 vehicles) and third-place Nevada (4.70 cars). At the other end, five states had less than 1 vehicle theft for every 1,000 registrations in 2012: Maine (0.84), Idaho (0.83), New Hampshire (0.79), Wyoming (0.73) and Vermont (0.72).
- District of Columbia: 11.36 thefts per 1,000 registered vehicles in 2012
- California: 6.09
- Nevada: 4.70
- Washington: 4.51
- Maryland: 3.77
- Georgia: 3.73
- Arizona: 3.71
- South Carolina: 3.39
- Oklahoma: 3.36
- Michigan: 3.22
- Texas: 3.21
- Rhode Island: 3.08
- Utah: 3.03
- New Mexico: 3.03
- Hawaii: 2.93
- Oregon: 2.89
- Missouri: 2.87
- U.S. Average: 2.84
- Kansas: 2.77
- Colorado: 2.65
- Illinois: 2.54
- Tennessee: 2.41
- Florida: 2.38
- Connecticut: 2.38
- Arkansas: 2.31
- Indiana: 2.28
- Nebraska: 2.20
- Mississippi: 2.11
- New Jersey: 2.08
- North Carolina: 2.07
- Alabama: 2.04
- Louisiana: 2.03
- Alaska: 1.96
- Ohio: 1.93
- Massachusetts: 1.87
- Kentucky: 1.82
- New York: 1.66
- Minnesota: 1.66
- Wisconsin: 1.58
- Delaware: 1.52
- West Virginia: 1.51
- Pennsylvania: 1.44
- North Dakota: 1.42
- Virginia: 1.28
- Iowa: 1.15
- Montana: 1.13
- South Dakota: 1.06
- Maine: 0.84
- Idaho: 0.83
- New Hampshire: 0.79
- Wyoming: 0.73
- Vermont: 0.72
Source: Federal Bureau of Investigation data via the National Insurance Crime Bureau; U.S. Department of Transportation
deeepblue/iStock/Thinkstock

Former Assistant Managing Editor-News Kelsey Mays likes quality, reliability, safety and practicality. But he also likes a fair price.
Featured stories


