Gas Prices Are Up, but So Is Average MPG

There are plenty of Americans who purchase a high-mileage vehicle for environmental reasons, and sales of plug-in hybrids and electric vehicles surged 84 percent in 2013. But when you start comparing the steady rise in sales of higher-fuel-economy vehicles to trends in gas prices, it becomes clear that American car buyers’ choices are influenced by what they’re paying at the pump. Still, despite sometimes-wild fluctuations in gas prices, once car shoppers at large have made up their minds to “go greener,” the tendency is to stick with it.
More Fuel Efficiency News on Cars.com
Comparing historical gas prices from AAA with data from the University of Michigan’s Transportation Research Center, a major milestone at the pump — $4-per-gallon gas — appears to have sent car buyers scurrying for more efficient vehicles. On June 8, 2008, a record surge in crude-oil prices pushed the national average for a gallon of regular unleaded gas to just more than $4, and there it stayed as the months of June and July logged average prices of $4.04 and $4.06, respectively.
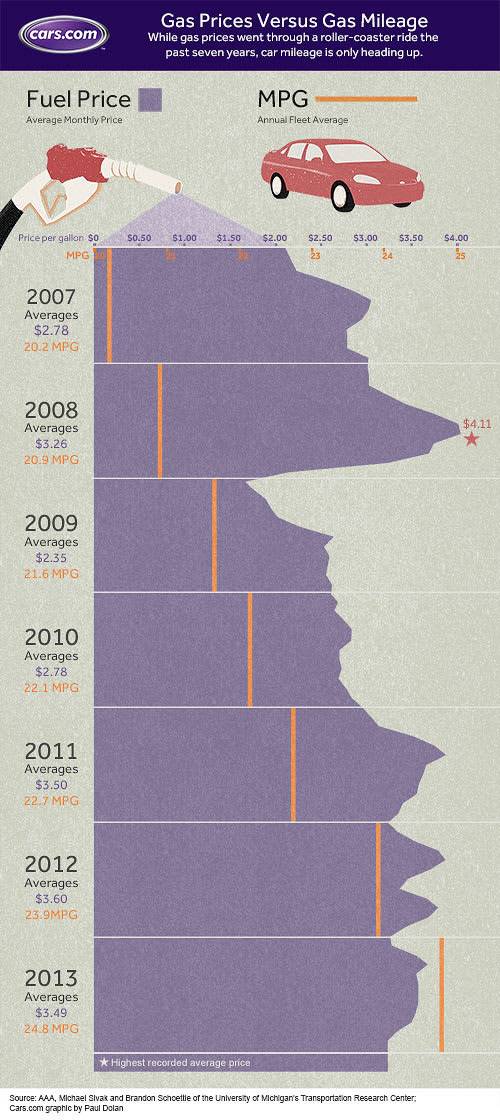
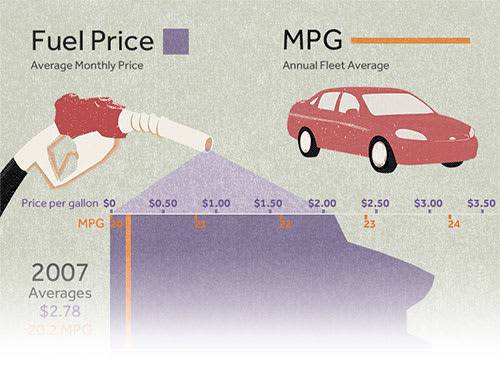
Transportation Research Institute data shows the average sales-weighted miles per gallon rating spiked to nearly 22 mpg in the weeks surrounding the price peak from just more than 20 mpg in January 2008, when gas prices averaged $3.04 a gallon. Translation: Skyrocketing gas prices caused new-car buyers to take action.
In the years that followed, the sales-weighted fuel economy average has continued to rise overall, even amid sporadic variations in fuel costs and despite some peaks and valleys along the way. Sales-weighted fuel economy fell sharply — getting back down to just 20.5 mpg — in the months that followed the $4 gas surge as prices fell substantially each month until reaching a low of $1.64 in December 2008 and not creeping back up to a monthly average of $2 a gallon again until April 2009.
That price plummet occurred during the nation’s most recent economic recession, when people were increasingly out of work and driving less, putting downward pressure on gas prices and hurting sales of hybrid cars. Still, in the nearly seven years since the University of Michigan has been tracking sales-weighted fuel economy data, the average has risen from 20.1 mpg in October 2007 to well over 25 mpg by the first half of 2014; that’s an improvement of more than 25 percent, or nearly 4 percent per year. [See the trend play out in the graphic above.]
The shock of $4 gas wasn’t the first time pocket-book-pillaging pump prices jump-started Americans’ affinity for efficiency. The energy crisis of the 1970s and its accompanying gas price spikes — huge by percentage, although the dollar figures seem small compared to today — whipped buyers hungry for better mileage into a compact-car feeding frenzy. In 1975, the federal government imposed the new corporate average fuel economy, or CAFE, standards requiring automakers to continually meet rising benchmarks for fleetwide fuel economy or face steep financial penalties.
According to data from University of Michigan’s Michael Sivak and Brandon Schoettle, the average fuel economy of all vehicles on the road embarked on a nearly uninterrupted 40-year climb starting in the early-1970s from less than 15 mpg to where it stands today. That followed a half-century of declining fuel economy, during which mileage dipped from about 14 mpg in 1923 to 12-13 mpg in 1973. It’s important to note that these historical on-road fuel-economy numbers pertain to all vehicles of all categories, and are not comparable to the window-sticker value used in sales-weighted fuel economy calculations from new cars and light-duty pickup trucks sold in the U.S.
Here are some other milestones and observations we gleaned from AAA’s historical fuel prices spanning the past decade:
- After years of a-buck-something gas prices, on May 19, 2004, a new peak was reached when prices hit $2.01.
- The first month gas prices averaged more than $2 was March 2005, after which they would not fall below that mark again until the tail end of 2008.
- On May 4, 2007, gas prices crossed the next threshold, $3.01, finishing that month at an average of $3.10 and the following month at $3.05 before falling below the $3 mark until that November.
- From November 2007 to May 2008, prices hovered in the $3 range on their way to an average exceeding $4 in June and July, but fell back into the 3s from August to October, into the 2s in November, and into the 1s from that December until March 2009.
- Prices crept back up, but remained under $3 from April 2009 to December 2010, again breaking the $3 mark in January 2011 and staying above it all the way to the present, where at last count the nationwide average stood at $3.68 a gallon.
- Another identifiable surge in Americans buying higher-fuel-economy vehicles came around July and August 2009, when the federal government administered the Car Allowance Rebate System, commonly known as the “cash for clunkers” program. The vehicle-buy-back program encouraged people to trade up for a more fuel-efficient car in place of their old one. Coinciding with the program, a temporary spike took average sales-weighted fuel economy from less than 21.5 mpg all the way up to 22.5 mpg before dropping back off to where it had been by about September of that year.

Former Assistant Managing Editor-News Matt Schmitz is a veteran Chicago journalist indulging his curiosity for all things auto while helping to inform car shoppers.
Featured stories
